The short version
At its best, a south-facing roof at 40° in Northwich makes about 941 kWh a year per kWp of panels (PVGIS). A common 35° south roof makes 939, east 752, west 743 and north 514. Shade from trees or neighbours comes off these.
The full table
| Roof faces | 10° | 20° | 30° | 35° | 40° | 45° | 50° |
|---|---|---|---|---|---|---|---|
| South | 854 | 903 | 932 | 939 | 941 | 938 | 929 |
| South-east | 835 | 868 | 886 | 889 | 887 | 881 | 871 |
| South-west | 832 | 863 | 879 | 881 | 878 | 871 | 860 |
| East | 784 | 775 | 762 | 752 | 740 | 725 | 708 |
| West | 781 | 770 | 754 | 743 | 730 | 715 | 697 |
| North-east | 730 | 672 | 617 | 590 | 564 | 539 | 513 |
| North-west | 729 | 669 | 614 | 587 | 562 | 536 | 510 |
| North | 707 | 630 | 553 | 514 | 477 | 440 | 405 |
Read across a row to see the effect of pitch, down a column to see direction. South-facing roofs hardly change between 30° and 45°. East and west roofs do best when shallow. North-facing roofs fall from 707 kWh at 10° to 405 at 50°.
Month by month
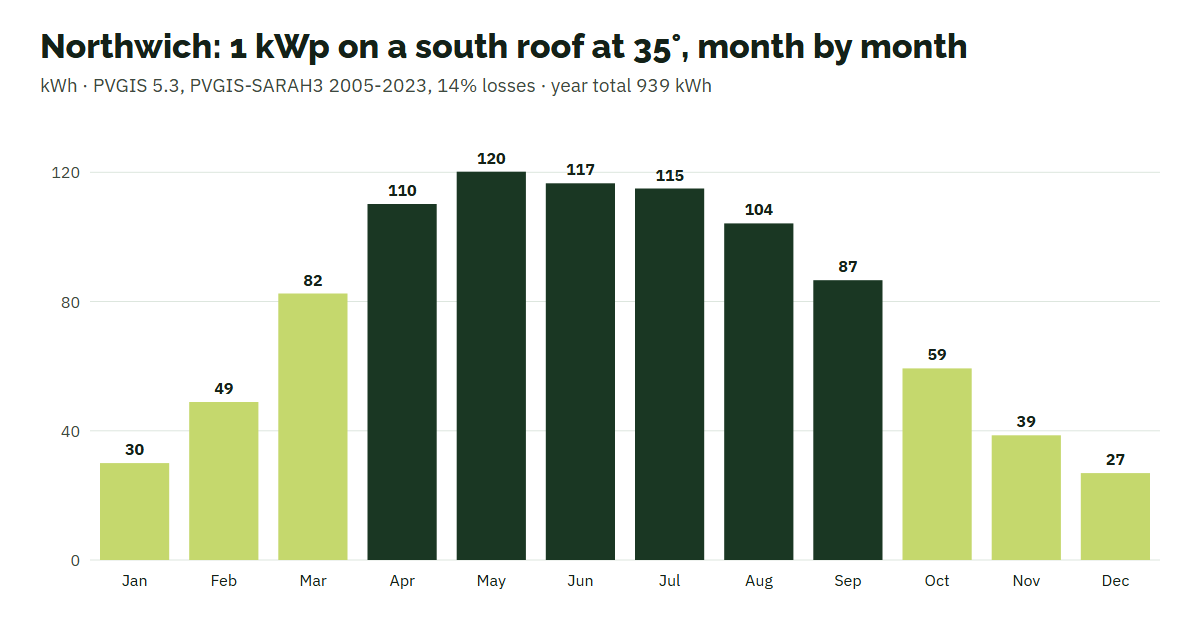
Most of a Northwich array’s output arrives in the six lighter months, when a household often cannot use it all at home. That is why export and self-use matter more than a few per cent of yearly output, and why some households add a battery.
The twelve months in figures
| Jan | Feb | Mar | Apr | May | Jun | Jul | Aug | Sep | Oct | Nov | Dec |
|---|---|---|---|---|---|---|---|---|---|---|---|
| 30 | 49 | 83 | 110 | 120 | 117 | 115 | 104 | 87 | 59 | 39 | 27 |
April to September brings 70% of the year’s output on that roof. December, the weakest month, makes about 27 kWh per kWp, so a 4 kWp array produces roughly 108 kWh in the whole month, while June produces about 466.
Sizes, worked out
| System | South | South-east | East | West |
|---|---|---|---|---|
| 2 kWp | 1,878 | 1,778 | 1,503 | 1,486 |
| 3 kWp | 2,817 | 2,666 | 2,255 | 2,228 |
| 4 kWp | 3,756 | 3,555 | 3,006 | 2,971 |
| 5 kWp | 4,696 | 4,444 | 3,758 | 3,714 |
| 6 kWp | 5,635 | 5,333 | 4,510 | 4,457 |
A semi or terrace with its ridge running north to south has one slope facing east and one facing west. Split 3 kWp each way and the pair makes about 4,483 kWh a year, a little under what the same 6 kWp would make on one south slope, but spread from early morning into the evening.
The model’s arithmetic
For central Northwich, PVGIS starts from about 1,160 kWh of sunlight per square metre a year on a south slope at 35°, averaged over 2005-2023 (PVGIS 5.3). Since a panel is rated in sunshine of one kilowatt per square metre, that is also what a flawless 1 kWp array would produce. From it the model deducts 3.2% for reflection when the sun is low against the glass and 4.4% for warm panels and weak light, adds back 1.7% because the local spectrum suits the cells, and then applies the 14% system allowance used throughout this site. The net reduction is 19.1%, leaving 939 kWh.
Pitch and the lie of the land
Northwich roofs run from shallow extension roofs to steep older slopes, and for a south-facing roof that range matters less than people expect. PVGIS’s own optimum here is 39°, giving 941 kWh per kWp; a 35° roof gives up only 2 kWh of that, and even a 50° slope keeps 99% of the best. Shallow south roofs lose more: at 10° the figure is 91% of the best. The land around the town barely registers. Running the same roof with the terrain horizon switched off adds only 2 kWh per kWp, about a quarter of one per cent, so in Northwich it is trees and buildings, not hills, that a shade survey has to find.
Better and worse years
Northwich sits in the middle of the six towns we modelled for how much its sunshine varies. The standard deviation from one year to the next is about 28 kWh per kWp, which for a 5 kWp array is roughly 142 kWh either side of the typical 4,696. Summer months carry most of that swing: May and July can each be about 15 kWh per kWp above or below their average. A first year that falls short after a wet summer says little; three years of meter readings say a great deal.
Salt-town roofs, same sunshine
Northwich’s ground changes what a roof can carry, not how much sun reaches it. Where a frame needs strengthening, or a listed building such as the liftable timber frames on Witton Street could only take panels on a rear range, read the smaller sizes in the table above. Off-gas households in Shakerley and the villages often ask whether panels can carry their heating; with about 108 kWh from 4 kWp in December, they cover little of a winter heating load on their own, as off-gas homes explains. Whatever the size, set it against the price per kW on the cost page.
What the model leaves out
- Shade. Trees in the leafier wards and taller neighbours near the centre cut output, most in winter.
- Roof condition. The model assumes an ordinary roof; on a house that has moved, the layout may be limited by what the structure can take. See subsidence and solar.
- Equipment. Inverter efficiency, panel temperature and ageing all move the real figure.
Using it against a quote
An MCS installer must give you a performance estimate for your roof before you sign (MCS). Multiply the figure for your direction and pitch by the system size and compare; if your roof does not fit the table neatly, describe it through the question form. Well above it needs explaining; a little below it, with shading noted, is often the honest answer. What the units are worth depends on your tariffs: exported units earn an export tariff under the SEG rules, units used at home save buying them. The roof readiness check uses the same table.